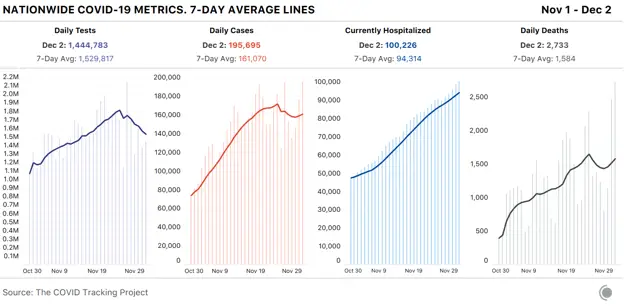
As expected, our picture of the COVID-19 pandemic in the United States in the past week is muddied by incomplete and delayed data, the result of the Thanksgiving holiday and long weekend. Although cases, tests, and deaths appear to have declined, we believe this is largely an artifact of data reporting and not reflective of the true toll the coronavirus is taking on the nation right now. The one metric not substantially affected by holiday reporting makes clear exactly how severe the pandemic is: More than 100,000 people in the United States—that’s one in 3,300 people—are now hospitalized with COVID-19.
There is some good news in the hospitalization data for a string of hard-hit Midwest states. The number of patients hospitalized with COVID-19 decreased in Illinois, Iowa, Minnesota, Nebraska, North Dakota, South Dakota, and Wisconsin—all states hit hard throughout the fall.
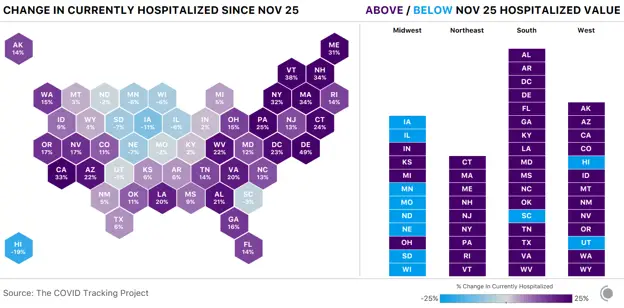
The current hospitalizations metric doesn’t distinguish between newly admitted COVID-19 patients and those who have been in the hospital for days or weeks already, so we looked at the new admissions data available from the U.S. Department of Health and Human Services to see if it shed any light on the situation in the Midwest.
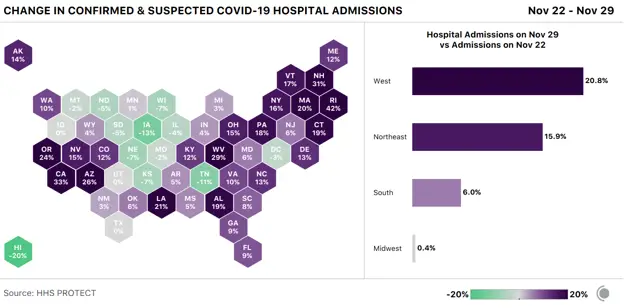
Of the seven Midwest states with drops in current hospitalizations, six also showed decreases in new COVID-19 admissions: Illinois, Iowa, Nebraska, North Dakota, South Dakota, and Wisconsin.
The only other state with drops in both hospitalization metrics is well outside the Midwest: Hawaii showed a 19 percent decline in current hospitalizations, backed up by a big drop in new admissions as well. Fewer than 1,300 people have been hospitalized in Hawaii since the pandemic began, and the state currently claims the country’s lowest per-capita case rate. This week South Dakota had the highest number of new cases per capita, followed closely by Minnesota and North Dakota. A state with Dakota in its name has had the highest rate of reported cases per capita for every one of the past 14 weeks. North Dakota has seen so many fatalities from COVID-19 that the state has stopped being able to reliably count deaths, as we described in a blog post earlier this week.
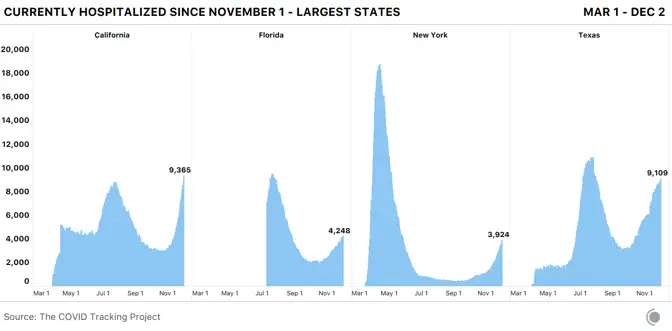
California, the nation’s most populous state, this week reported more COVID-19 cases than any other U.S. state or territory (on a per-capita basis, it ranks solidly in the middle). Still: One in 1,900 California residents was identified as a COVID-19 case, and one in 4,200 is hospitalized with COVID-19. On Monday, California Governor Gavin Newsom warned that the state’s hospitals are rapidly filling up, and he suggested the state could run out of ICU beds in some regions by mid-December. The White House Coronavirus Task Force also said that post-Thanksgiving surges could put hospitals nationwide over the edge, further compromising patient care.
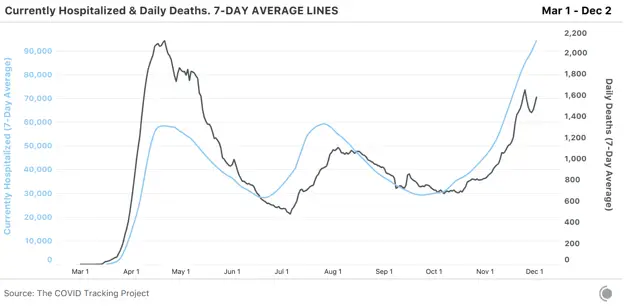
On Wednesday, CDC Director Robert Redfield cautioned that the next few months could be “the most difficult time in the public-health history of this nation,” and said the country’s death toll could reach 450,000 by February. As hospitalizations continue rising nationally, we should expect rising deaths to follow. Thanksgiving reporting caused the seven-day average for reported deaths to dip sharply, but we expect reported deaths to return to their previous trend once the holiday data irregularities have passed.
A few days before Thanksgiving, we posted a warning that we expected U.S. COVID-19 data to get knocked off track by the holiday’s effects on testing and reporting. One week later, it’s time to see what actually happened, how closely it followed our expectations, and what we think is yet to come.
Based on the patterns we’ve seen on weekends and over previous holidays, we predicted that case, test, and deaths data would flatten or drop over the holidays, then spike again afterward as backlogged data rolled in.
Here’s what actually happened, and what we think is yet to come:
- Reported tests fell as expected, and as of Wednesday, haven’t really recovered. We expect that test backlogs will continue to roll in, likely producing spikes that are clearly visible in individual states and in some cases at the national level. It’s not possible to tell from the data we compile whether the low testing numbers we’re seeing reflect mostly reporting delays or missed/delayed tests over the holiday weekend, but both are likely factors.
- Case numbers dropped on Thanksgiving, spiked the next day as many states reported two days of data, and then fell again over the weekend. We are now seeing them rise very quickly. This is what we expected to see after the holiday, and it’s important to note two things: First, we can’t tell how big the holiday backlog is, so there’s no way to know how much of a rise to expect as it’s resolved, or how long it will take. Second, we are not yet seeing cases rise as a result of Thanksgiving weekend exposures. As we’ve written about in more detail, it’s still too soon to see those cases in any significant numbers, given what we know about the disease progression and the delays in reporting systems.
- As noted above, hospital numbers were affected the least by the holiday, and they continue to rise steadily.
- Reported deaths were very low for several days through the holiday weekend and on Monday. They have risen sharply since—again, a pattern we expected to see and may see more of as reports finally roll in. It is not possible today to understand which increases in reported deaths are related to backlogs and which are related to actual rises in deaths—which we also expect to see, given that reported deaths follow cases and hospitalizations up (and down) the curve, several weeks behind.
Although data about how many people are currently hospitalized are one of our most consistent lenses into the current state of the pandemic, these data do not help us understand the current situation for different demographic groups. Of the 56 states and territories we track, only 21 report hospitalization data by race or ethnicity; the missing states contain more than 60 percent of the nation’s population.
Despite this incomplete hospital data, we are able to get a picture of some of the race- and ethnic-based disparities in hospitalization counts. Alaska, for example, reports that Native Hawaiian and other Pacific Islanders are more than 20 times as likely to be hospitalized as white people, and American Indians or Alaska Natives, who make up 14 percent of the state’s population, are four times as likely to be hospitalized as the white residents.
In 11 of the 16 states that report for Indigenous people, those groups are more than twice as likely to be hospitalized as white people; in New Mexico, American Indians or Alaska Natives are more than nine times as likely as white people to be hospitalized. In South Dakota, one in 78 American Indians or Native Alaskans is hospitalized, compared with one in 231 white people and one in 3,300 people nationwide.
Other notable disparities are for Black people in Maine, who are more than five times as likely to be hospitalized as white people in the state, and in New York, where they are nearly five times as likely to be hospitalized. In both New York and Virginia, Latinx people are more than four times as likely as white people to be hospitalized.
There’s both terrible and encouraging news about the pandemic in nursing homes and other long-term-care facilities this week. More than 100,000 deaths are now linked to these facilities; they represent 6 percent of all COVID-19 cases in the United States and 39 percent of deaths. But relief may be on the way: This week a committee at the CDC recommended that the first doses of the likely soon-to-be-approved COVID-19 vaccines be administered to health-care workers and residents of long-term-care facilities.
If you’re using test, case, and deaths data to explain the movements of the pandemic in the United States, we recommend that you use caution through early next week. The record highs we’re seeing in cases—and that we may soon see in deaths—are real numbers, but should not be interpreted as normal daily reports that definitively indicate a worsening situation. We hope and expect that by the middle of next week, most U.S. jurisdictions will have cleared any remaining backlogs. Until then, keep your eye on hospitalization metrics, which remain clear and useful.
Finally, if you’re looking for possible rises in cases from Thanksgiving exposures, we think you’re unlikely to see them before the second or third week of December. To make sure you’re not fooled by reporting irregularities, keep your eye on the seven-day average and watch for a sustained rise—and, as always, check in with public-health experts for detailed context and caveats.
Alice Goldfarb, Erin Kissane, Jessica Malaty Rivera, Charlotte Minsky, Joanna Pearlstein, and Peter Walker contributed to this report.
