How do you measure the value value of new treatments that improve survival? Clearly one of the key factors for doing so is understanding how much each treatment can improve survival relative to the status quo. In practice, however, estimating this quantity is challenging in practice.
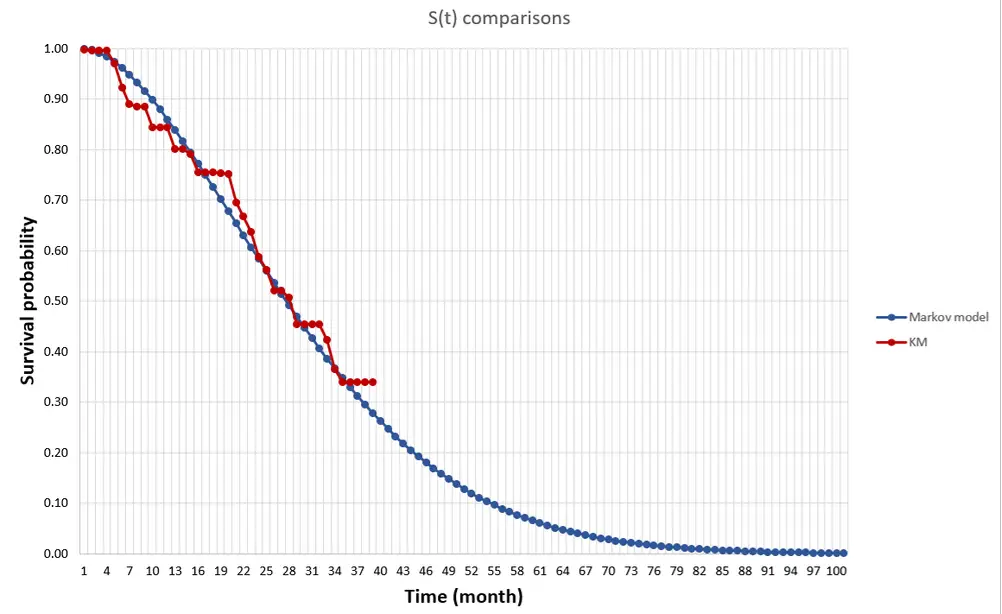
First, when we say survival gain, do we mean median survival or mean survival? Median survival is easier to estimate since you just need to know the median survival for the “typical” person (i.e., someone at the 50th percentile). For mean survival, you would need to know the survival of everyone in the distribution and average over those people. While my research shows that patients generally care most about mean rather than median survival, estimating this is more difficult with clinical trial data. Clinical trials are short and thus one would need to extrapolate survival for all people based on mortality information for a limited number of people for whom we observed death. In the picture below, the line in red is the Kaplan-Meier curve based on clinical trial mortality data and the blue curve is an extrapolation. We can use Kaplan-Meier to calculate the median, but we need the extrapolation to get the mean.
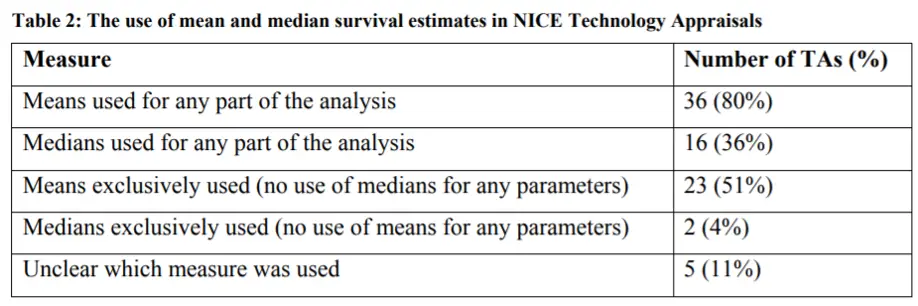
The National Institute for Health and Care Excellence (NICE) has a DSU Technical Document on Survival Analysis for Economic Evaluations. The document examines which types of models are most commonly used. They find that most HTA submissions do use means, but some also will also use median survival estimates as well.
If you need to extrapolate means, how is this most frequently done?
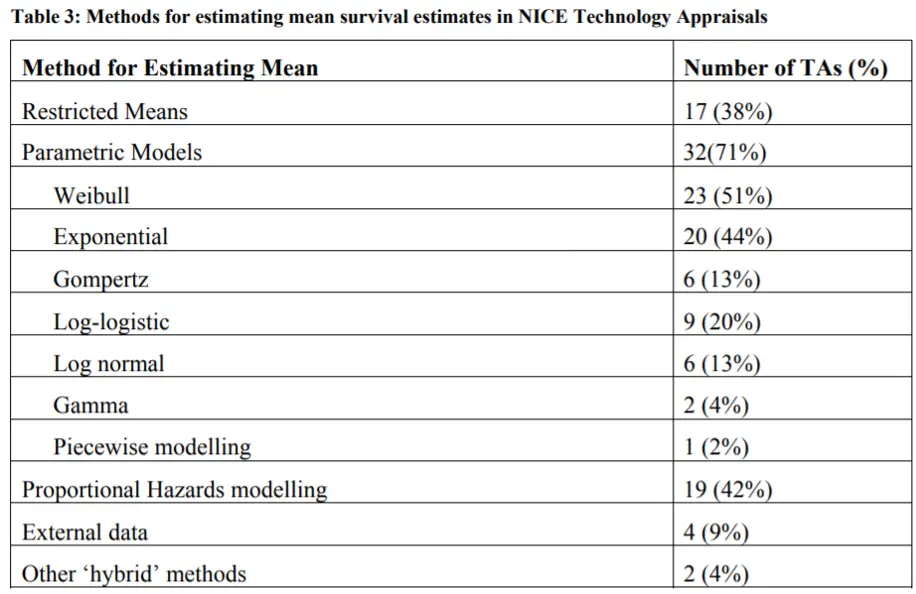
Parametric models are most often used, and the most common ones used for HTA submissions are Weibull and exponential. This is shown in the table below. An exponential distribution assumes a constant proportional hazard and is simplest to estimate. Weibull and Gompertz distributions assume monotonically increasing or decreasing hazard ratios, which adds some flexibility. Log-logistic and lognormal assume an initial increasing hazard and later a decreasing hazard. These last two functions allow to better fit the data when there is a fat tail in the survival distribution, but can overestimate survival if the fat tails are not likely to materialize in practice. The gamma distribution can incorporate all these trends, is the most flexible, but requires estimating more parameters.
There are other extrapolation methods such as piecewise models, spine models, cure models, landmark models, or mixture models. However, the NICE document does do a nice job of summarizing the most commonly used approaches for extrapolating survival curves.